
db2Gdba
Part 2
This section describes the db2Gdba functionality. For tips on how to better use the application, and quickly retrieve useful information go to the tip session.
Note: Marked records or marked objects in this document refer to records in a grid with the check-box column checked. To check/uncheck records, click on the check box or press the space bar. Selected record or selected object refers to the one with the active focus.
Tab Table Spaces

List View.
Displays the list of tablespaces with their more commonly used features like type, owner, create time, data type, overhead, transfer rate, drop recovery, buffer pool, and database partition group.
For a selected tablespace you can see more features by clicking the More button. Also you can see the current tablespace status, the list of tables defined in it (including partitions of range-partitioned tables), tablespace containers, buffer pool parameter values, database partition group, and authorizations on the tablespace.
If you mark multiple records (tablespaces), you can prepare a list of commands for all of them using a predefined or custom command. You then save or copy them, and paste these commands in a db2 query editor or CLP window to execute. You also can change the authorization of the marked tablespaces at once from/to one or more users.
Status View.
Displays the list of tablespaces, but emphasizes on their status like state, rebalancer mode, rebalancer start time, minimum recovery time, total size, usable size, used size, free size and current watermark. The information in the grid can be seen at the database partition level or summarized by tablespace.
At the top of the tab you will find the summary value for all tablespace sizes mentioned above. This also includes the "dirty size” — provided the db2 database parameter TRACKMOD is set to YES. This allows one to track tablespaces that have changed since the last online full or differential backup. This dirty size, along with the information from the grid, provides the disk size, and tablespaces your next online tablespace backup should include (see figure below).

Skew Disk Space Allocation (multi-partitioned databases only).
This view provides a list of tablespaces having irregular disk space allocation issues.
In a multi-partitioned database system, a tablespace will have disk space allocated in each of the database partitions where its database partition group is defined. In a well-distributed database, we expect each of these allocated spaces to grow evenly as the tables in the tablespace grow.
The analysis of data skew should be done at the table level, counting records in each of the database partitions where the given table is defined. However, this process can take time and resources for huge tables in big data warehouses. As you will see below, db2gdba offers this calculation at the table level.
The skewed-disk-space-allocation view runs a fast report that looks up the tablespace database partition with less allocated disk space and the tablespace database partition with most allocated disk space for each tablespace. Then, it displays the database partition number (smallest node), its tablespace allocated disk size (smallest node disk size), the database partition number (largest node), its tablespace allocated disk size (largest node disk size), and the difference if it’s >0.
The difference between the largest and smallest tablespace sizes should be minimal. By sorting the grid by difference, you can locate the worst tablespaces at the top of the grid. Then clicking the Table Disk Allocation button, you can see the list of tables belonging to the selected tablespace with the disk size they actually have in these two database partition nodes if the difference is > 1%. This way you can determine which tables are good candidates to be analyzed for data skew further on.
Since the difference between the largest and the smallest node is calculated using the actual disk space allocated, sometimes the difference in the space size of a tablespace in different nodes is due to un-reclaimed empty disk space and not necessarily poor distribution of records.

Graph View.
The graph view is a very visual tool. It presents a bar for each tablespace, or for each tablespace database partition node with several of their sizes. You can determine how full they are, how well distributed they are, and more.
In multi-partitioned db2 systems where the disk space pre-allocation is an issue of performance, like in some PDOA systems using general parallel file system (GPFS), this view provides a quick overview of the tablespaces that should be extended to pre-allocate free space.

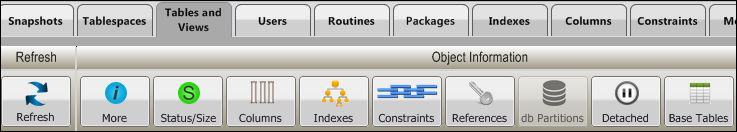
Tab Tables & Views
Displays the list of tables (all types) of the database.
This interface is very useful when you are looking for specific tables in your database You can use a criteria in the search box to retrieve a specific list of tables, or to filter the retrieved list of data. You can also select to display tables by their specific type, like MQT, alias, table, temp table, view, etc.
For objects having both schema and object name, like tables, if the search criteria contain a dot, db2gdba will use the letters before the dot to retrieve the objects with schema name like these letters. The same applies to the object name with the letters after the dot. By typing in the search box again you may further filter down the list.

More: Displays a window with all the field values from the syscat.tables view.
Status/Size: Displays the status of the table at the database partition level, and the values of the data, index, long, lob, and xml sizes of the table. If multiple records are marked, a grid for the marked group of tables and the values of these sizes, along with the totals is displayed.
Columns: Displays some of the fields from syscat.columns view of the selected table. In this window you also can query the record count of the table, and some aggregate values for columns. More information about a specific column is obtained clicking More.
The figure below illustrates the columns of a table and some quick aggregate one can be interested to find.
If the table in question is a data-partition to a range-partitioned table, db2gdba calculates these aggregate values between the low and high key values.

Indexes: Displays the secondary index of the selected table.
Constraint: Displays the constraints of the selected table.
References: Displays the references for the selected table.
db Partitions:If the table is range partitioned, this window illustrates all the data partition ranges for the table.
This interface has functionality for the user to quickly get command syntax like Add, Attach, Detach, etc., for the selected in the grid range of the table (see figure below). You can use this interface also when you need to detach, or attach range partitions and you’d like to have these commands quickly ready.

Detached: If the table is range-partitioned, this function retrieves any detached table this table might have.
Based Tables: Displays the base tables of the selected table.
Dependants: Displays the dependent objects of the selected table.
Compression: If built, it displays the compression dictionary for the selected table.
Authorization: Displays the authorizations on the selected table. The authorization window displays all users and their privileges on that particular table (see figure below). You can modify the type of privilege for any user by selecting the user from the database user list – filtered in our case using the word ‘use’. Note that in this view, you see all users having privileges on the given object (user1 and user2 in our case). You can also add more users to have authorizations on this table right here.

For multiple marked objects though, you can modify privileges on various objects for a particular user at once, and continue doing the same step for other users (see figure below). Note how all commands executed behind the scene are displayed.
In this particular case, three tables were marked and the Authorization button clicked. To quickly find the interested users user1 and user2, I typed the word user to filter the list. The user user1 was selected and Alter clicked. This lead to three Grant Alter commands applied to user1. Then user user2 was selected and Select clicked. Three Grant Select commands were applied to user2.

DDL: Displays the DDL of the selected table. For multiple marked objects, displays the DDL for these objects.
The figure below is the result of selecting 3 objects (2 tables and 1 view) and clicking DDL.

Data Skew: This function performs a detailed data-skew analysis if the table is defined in a multi-partitioned tablespace. The figure below is the result of selecting a table in the grid and clicking Data Skew.
The analysis is performed at the record-count level, and the query used to analyze that particular table can be copied to the clipboard if desired.

Distribution:This analysis is not as accurate as the data-skew analysis described above, but it performs a record distribution analysis faster. What it does is to show how the table records are distributed across database partitions so you can find potential data skew.
If a table is defined in a partition group of 64 data nodes (P.G. Nodes), the table then should have records across all 64 nodes (Data Nodes). In the figure below, the second table in our case found records only in 3 of its 64 data nodes. Unless this table has been partially populated, this is a potential case of a table with a poor distribution key.
As you can see, there is a field header called Data Partition Name not populated in this grid. This field will have a value if the table in question is a partition to a range-partitioned table. That means you can also analyze specific partitions of range-partitioned tables for both record distribution and for data skew analysis. This provides a way for a dba to do this type of analysis at a partition level instead of the whole table.
These types of tables are illustrated with the tab Table Spaces. If you select a tablespace from any of the tablespace views described above, and you click Tables. The resulting window will illustrate all tables defined in the tablespace. This can include regular tables and tables that are partitions to range-partitioned tables.

Further, more detailed data skew analysis can be done right here clicking Detailed.
Commands:For marked objects, you can use this functionality to generate a list of commands to run on a specific set of tables. You generate the list and save it to a file, or copy it in any db2 client utility.
Copy:Copy the records shown in the grid into the clipboard in tab-delimited format. This information can be pasted into an excel spreadsheet.